Your race, on the web
See Sailing takes your data and renders it beautifully:
Processed, filtered, but preserving the fine details.
Drag or zoom the 3d view to see from a different position.
Red/green strip shows the wind direction, speed and tack bias.
White/grey shows movement of the mast through the air (with heel) and SoG.
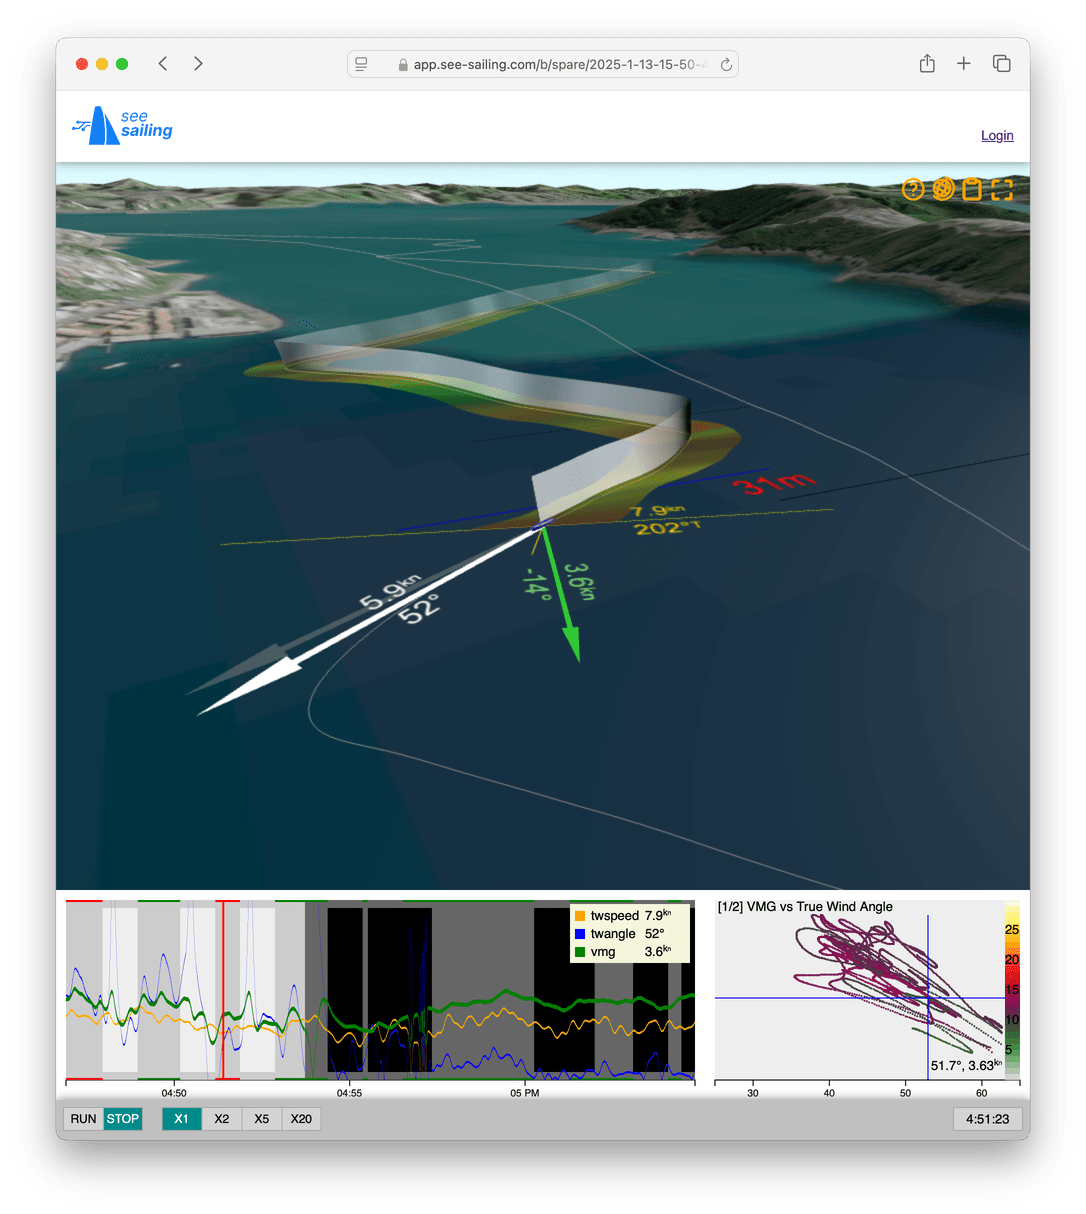
A single click to share the current location, pov and playback speed with crew, coaches and supporters.
Overview shows beats/runs, tacks/gybes and performance graphs.
Scatter diagram shows your current performance in context.
Drag or zoom the overview to explore your race.
No buffering, no stutters, a simple elegant tool.

Mobile app uploads straight to the web.
Your analysis can be online before you leave the boat.
Next generation analysis
Loss of distance made good is calculated from a pre-manoeuvre sample and prediction.
Which were your fastest tacks and gybes?
Are you consistent?

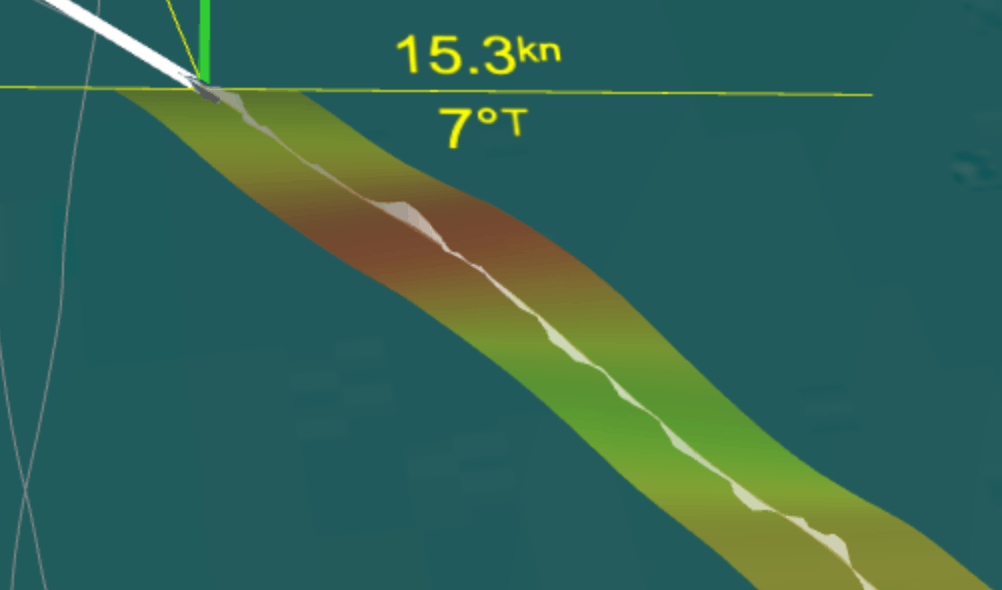
Evolving tack bias and wind strength are shown front and centre.
Are you sailing in phase?
Fell into a predictable hole?
Average pointing angles are reported per stretch.
Compare two helms,
or a consistent port/starboard difference reveals a calibration problem.

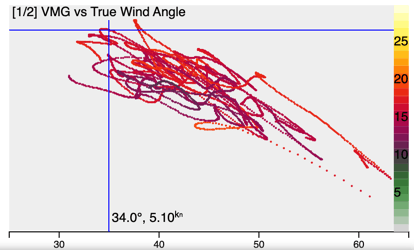
The scatter diagram plots two parameters against each other across the entire leg.
You can see (for instance) where your optimum pointing angle is; or how much time you spend near your optimum angles
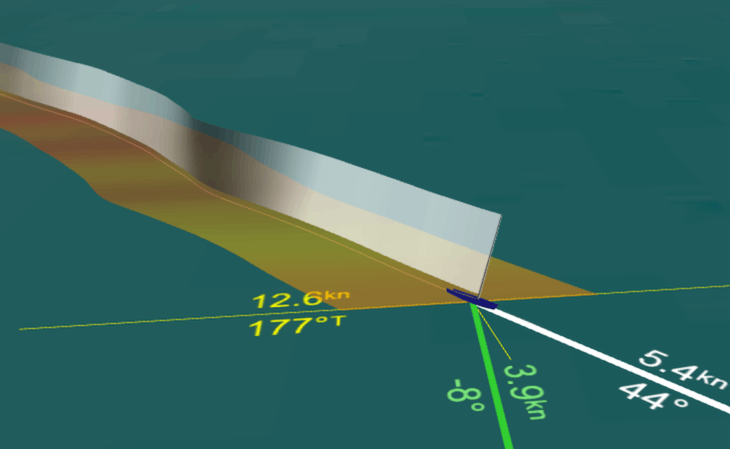
By keeping the fine details, errors in technique can be seen and diagnosed.
Here the helmsman overcorrects for a lift upwind and drops out of the groove. The resulting slowdown and recovery are clearly visible.
Exact definitions further examples and more are in the documentation.
By uploading data to See Sailing you are granting us a license to use that data for the purposes of further analysis and display.
We will not share your data with third parties without your consent.
We will contact you via the email address associated with your credit card with information necessary to the operation of your See Sailing account.
Please ensure it is valid and does not route to 'junk'.